-
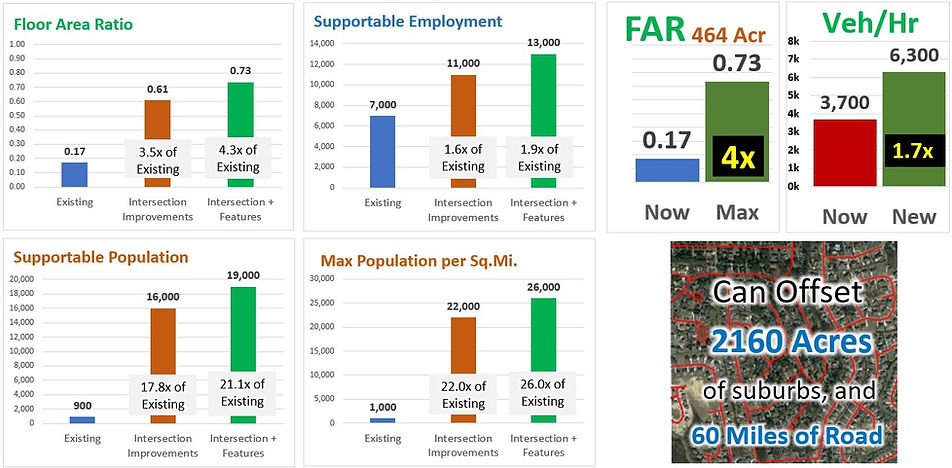
How much development can a corridor support?
-
How much suburban sprawl can a walkable design offset?
-
How many miles of infrastructure does it offset?

Stroad corridors often carry 30,000+ vehicles per day, but they still become congested at low suburban densities. This is usually because the connectivity and parallel options are poor. To make such corridor capable of supporting urban-scale, walkable development, planners often propose transit investments, bike/ped investments, connectivity enhancements, and more recently "Placemaking Alternative Intersections" as strategies for increasing multimodal accessibility.
As part of a research effort for the North Carolina Department of Transportation, Urban Innovators and NCSU's Institute for Transportation Research (ITRE) created an Excel-based "Development Scale Calculator." As input, the user tells the tool 1) today's peak hour vehicle capacity at key intersections (from Synchro or a microsimulator); 2) today's development within the study area (approximate number of residential units and commercial square feet); 3) through-trip percentage, and 4) existing multimodal features.
After that, the user inputs similar values for a potential future: 1) higher vehicle capacity? perhaps made possible by Placemaking Alternative Intersections; 2) additional development (where mixed-uses and higher density results in fewer vehicle trips per capita, but probably more overall vehicle trips); 3) change in expected through trip percentage? 4) Enhancements to multimodal features?
The tool then estimates vehicle trip generation and the probable volume/capacity ratio at key intersections. As the user introduces features that reduce the v/c ratio (either through higher capacity or less demand), this makes it easier to increase step 2 (i.e., increase development). The result is the maximum amount of development that the area can support at the point where key intersections will probably operate at Level of Service E.